
/BACK
To be more specific, we'll look at the case where the columns are sorted according to modulo deviance, and only the first "N" columns are presented, while the remainder are grouped as "Others."
To make the work a bit easier, we'll break it down into sections:
- Creating a special dimension that we will use in the diagram
- Writing a calculated measurement taking into account the ranking of columns and displaying only the top "N" largest deviations
- Writing a formula for calculating deviations
- Summarizing the results of their work.
Before starting the implementation, it's important to understand why the work is more complicated than it appears on the surface:
Only the top "N" values are shown, with the rest hidden in the "Others" section. It may appear at first that this is straightforward because the chart settings have a "Dimension limits" tab. But it doesn't work in the waterfall diagram - not only are the deviation columns concealed, but the totals columns, as well as the "Others" column, are always near the end of the diagram, and we need the final value "Current Year" after it. The deviations are ranked in descending order. The waterfall with the first and last columns makes the work much more difficult. Writing a distinct phrase in sorting seemed too complicated. As a consequence, I used the dual() method in the computed dimension to do this.
Now let's take a deeper look at each individual step's implementation.
Adding a unique dimension to the chart
We'll utilize the concept of generating a particular dimension in a script and then using it in a diagram in our work.
We shall have two groups of metrics in our situation:
«Totals» are the beginning and the end of our waterfall, let's take the current and previous year as an example and assign this group the appropriate attribute.
«Detail» is the data on which we need to calculate deviations. For example, let it be product groups. We will assign the corresponding attribute to this group as well.
So, it appears that we have two groups (the table will be included in the article's materials):
The "Attribute" column holds the attribute that will be used to differentiate the totals (first and last columns) from the deviations (everything in the middle) in the set analysis.
The "Name" column gives the name of the element in the diagram that is being grouped. We'll utilize it as a bar chart measurement.
The "Code" column is the group code, which will be used as a key for tying the fact table together.
We can simply construct the waterfall diagram by adding this dimension and a simple condition to the computation phase.
Creating a derived dimension
Let's have a look at what has to be done in order to attain the desired outcome:
- Separate the totals and deviation columns, and ensure they're both presented correctly (in my implementation, I hardcoded and assigned them sorting indexes -1000 and 1000)
- Find the deviation modulus rating (descending) for the deviation columns and segregate anything less than a specific value (in our case, the vTop variable)
- Output the value "Others" for the remaining deviations (those with a lower rating than the vTop variable).
The following is the (commented) code for completing this task:
=Aggr(
 //  We define the final columns, the first and the last
 IF(Only({}Name) = 'Previous year',
         dual(Only({}Name),-1000),
 IF(Only({}Name) = 'Current year',
         dual(Only({}}>}Name), 1000),
    //  We rank in descending order of the deviation module of product groups
 IF(
         Rank(
                 Fabs(
                             Sum({<
                                     Attribute -= {'Totals','Coefficient'},
                                     Date  = {'>=$(=MakeDate(2017,1,1)))<=$(=MakeDate(2017,12,31))'}
                             >}[Qty])-
                             Sum({<
                                     Attribute -= {'Totals','Coefficient'},
                                     Date  = {'>=$(=MakeDate(2016,1,1)))<=$(=MakeDate(2016,12,31))'}
                             >}[Qty])
                 )
                 ,1
         ) <= $(vTop),
            // Everything above the vTop parameter is displayed in the diagram
               dual(
                 Only({}Name),
                 Rank(
                         Fabs(
                                     Sum({<
                                             Attribute -= {'Totals','Coefficient'},
                                             Date  = {'>=$(=MakeDate(2017,1,1)))<=$(=MakeDate(2017,12,31))'}
                                     >}[Qty])-
                                     Sum({<
                                             Attribute -= {'Totals','Coefficient'},
                                             Date  = {'>=$(=MakeDate(2016,1,1)))<=$(=MakeDate(2016,12,31))'}
                                     >}[Qty])
                         )
                         ,1
                 )
         ),
            // Everything below the vTop parameter is put into the 'Others' group
         dual('Others',999)
    )))
       ,Name)
Explanation of the code:
- The Aggr() function is used so that the deviation formula in the measurement can be calculated.
- The Dual() function is used so that it is possible to sort by numeric value (the "Numeric Value" section on the "Sort" tab) without repeating complex conditions in the sorting by expression section (the "Expression" section on the "Sort" tab).
- Fabs() function - allows you to calculate the deviation modulus.
- The Rank() function calculates the rating of each product group and allows you to cut off unnecessary ones and put them in the "Others" group.
- The vTop variable stores the upper bound parameter for placing unnecessary groups in the "Others" group. In the demo application, this parameter is adjusted by a slider.
Developing the final expression
We'll look at three zones before writing the final formula:
- Expression
- Background color
- Columns shift along the axis of "He" (shift by the sum of the current and previous columns)
Let's begin with (1):
If(WildMatch(Name,'Previous year','Current year','*'),
 Pick(
                  WildMatch(Name,'Previous year','Current year','Coefficient','*'),
                  // for the previous year, we take the data of 2016
           Sum({=$(=MakeDate(2016,1,1)))<=$(=MakeDate(2016,12,31))'}>}[Qty]),
                  // for the current year, here are the data of 2017
           Sum({=$(=MakeDate(2017,1,1)))<=$(=MakeDate(2017,12,31))'}>}[Qty]),
                  // for product groups, we take the deviation
           Sum({=$(=MakeDate(2017,1,1)))<=$(=MakeDate(2017,12,31))'}>}[Qty])-
           Sum({=$(=MakeDate(2016,1,1)))<=$(=MakeDate(2016,12,31))'}>}[Qty])
   ),
          // if the group is not included in the list of required, then we use this formula
   // in our case, this is the 'Others' group
   Sum({=$(=MakeDate(2017,1,1)))<=$(=MakeDate(2017,12,31))'}>}[Qty])-
   Sum({=$(=MakeDate(2016,1,1)))<=$(=MakeDate(2016,12,31))'}>}[Qty])
   )
Explanation of the code:
At the beginning of the formula, we verify whether the current dimension element is in the data array; if it isn't, we use the formula for the "Others" group.
At the beginning of the formula, we verify whether the current dimension element is in the data array; if it isn't, we use the formula for the "Others" group.
Let's move on to the background color (2):
      If(Attribute = 'Totals', Blue(),
      If(Expression < 0, Red(),Green()))
Next, the expression for shifting columns (3):
If(Attribute <> 'Totals',
    rangesum(above( 'Expression', 1, rowno() )),
    0
 )
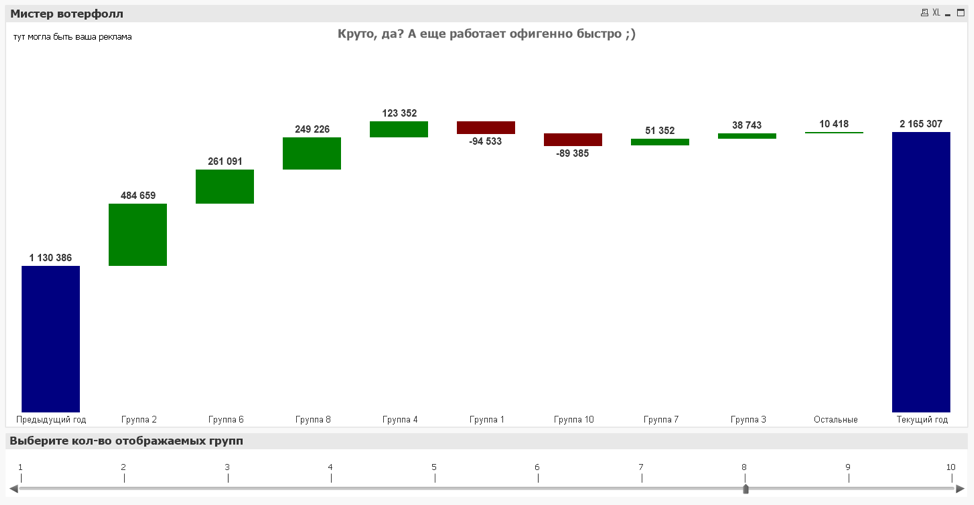
This technique is extremely simple: we determine the indent as the sum of the current and all preceding columns for any deviation columns, because otherwise the indent is 0.
As a result, we have the following:
As a result, we have the following:
/BACK
To be more specific, we'll look at the case where the columns are sorted according to modulo deviance, and only the first "N" columns are presented, while the remainder are grouped as "Others."
To make the work a bit easier, we'll break it down into sections:
- Creating a special dimension that we will use in the diagram
- Writing a calculated measurement taking into account the ranking of columns and displaying only the top "N" largest deviations
- Writing a formula for calculating deviations
- Summarizing the results of their work.
Before starting the implementation, it's important to understand why the work is more complicated than it appears on the surface:
Only the top "N" values are shown, with the rest hidden in the "Others" section. It may appear at first that this is straightforward because the chart settings have a "Dimension limits" tab. But it doesn't work in the waterfall diagram - not only are the deviation columns concealed, but the totals columns, as well as the "Others" column, are always near the end of the diagram, and we need the final value "Current Year" after it. The deviations are ranked in descending order. The waterfall with the first and last columns makes the work much more difficult. Writing a distinct phrase in sorting seemed too complicated. As a consequence, I used the dual() method in the computed dimension to do this.
Now let's take a deeper look at each individual step's implementation.
Adding a unique dimension to the chart
We'll utilize the concept of generating a particular dimension in a script and then using it in a diagram in our work.
We shall have two groups of metrics in our situation:
«Totals» are the beginning and the end of our waterfall, let's take the current and previous year as an example and assign this group the appropriate attribute.
«Detail» is the data on which we need to calculate deviations. For example, let it be product groups. We will assign the corresponding attribute to this group as well.
So, it appears that we have two groups (the table will be included in the article's materials):
The "Attribute" column holds the attribute that will be used to differentiate the totals (first and last columns) from the deviations (everything in the middle) in the set analysis.
The "Name" column gives the name of the element in the diagram that is being grouped. We'll utilize it as a bar chart measurement.
The "Code" column is the group code, which will be used as a key for tying the fact table together.
We can simply construct the waterfall diagram by adding this dimension and a simple condition to the computation phase.
Creating a derived dimension
The "Name" column gives the name of the element in the diagram that is being grouped. We'll utilize it as a bar chart measurement.
The "Code" column is the group code, which will be used as a key for tying the fact table together.
We can simply construct the waterfall diagram by adding this dimension and a simple condition to the computation phase.
Creating a derived dimension
Let's have a look at what has to be done in order to attain the desired outcome:
- Separate the totals and deviation columns, and ensure they're both presented correctly (in my implementation, I hardcoded and assigned them sorting indexes -1000 and 1000)
- Find the deviation modulus rating (descending) for the deviation columns and segregate anything less than a specific value (in our case, the vTop variable)
- Output the value "Others" for the remaining deviations (those with a lower rating than the vTop variable).
The following is the (commented) code for completing this task:
=Aggr(
 //  We define the final columns, the first and the last
 IF(Only({}Name) = 'Previous year',
         dual(Only({}Name),-1000),
 IF(Only({}Name) = 'Current year',
         dual(Only({}}>}Name), 1000),
    //  We rank in descending order of the deviation module of product groups
 IF(
         Rank(
                 Fabs(
                             Sum({<
                                     Attribute -= {'Totals','Coefficient'},
                                     Date  = {'>=$(=MakeDate(2017,1,1)))<=$(=MakeDate(2017,12,31))'}
                             >}[Qty])-
                             Sum({<
                                     Attribute -= {'Totals','Coefficient'},
                                     Date  = {'>=$(=MakeDate(2016,1,1)))<=$(=MakeDate(2016,12,31))'}
                             >}[Qty])
                 )
                 ,1
         ) <= $(vTop),
            // Everything above the vTop parameter is displayed in the diagram
               dual(
                 Only({}Name),
                 Rank(
                         Fabs(
                                     Sum({<
                                             Attribute -= {'Totals','Coefficient'},
                                             Date  = {'>=$(=MakeDate(2017,1,1)))<=$(=MakeDate(2017,12,31))'}
                                     >}[Qty])-
                                     Sum({<
                                             Attribute -= {'Totals','Coefficient'},
                                             Date  = {'>=$(=MakeDate(2016,1,1)))<=$(=MakeDate(2016,12,31))'}
                                     >}[Qty])
                         )
                         ,1
                 )
         ),
            // Everything below the vTop parameter is put into the 'Others' group
         dual('Others',999)
    )))
       ,Name)
Explanation of the code:
- The Aggr() function is used so that the deviation formula in the measurement can be calculated.
- The Dual() function is used so that it is possible to sort by numeric value (the "Numeric Value" section on the "Sort" tab) without repeating complex conditions in the sorting by expression section (the "Expression" section on the "Sort" tab).
- Fabs() function - allows you to calculate the deviation modulus.
- The Rank() function calculates the rating of each product group and allows you to cut off unnecessary ones and put them in the "Others" group.
- The vTop variable stores the upper bound parameter for placing unnecessary groups in the "Others" group. In the demo application, this parameter is adjusted by a slider.
Developing the final expression
We'll look at three zones before writing the final formula:
- Expression
- Background color
- Columns shift along the axis of "He" (shift by the sum of the current and previous columns)
Let's begin with (1):
If(WildMatch(Name,'Previous year','Current year','*'),
 Pick(
                  WildMatch(Name,'Previous year','Current year','Coefficient','*'),
                  // for the previous year, we take the data of 2016
           Sum({=$(=MakeDate(2016,1,1)))<=$(=MakeDate(2016,12,31))'}>}[Qty]),
                  // for the current year, here are the data of 2017
           Sum({=$(=MakeDate(2017,1,1)))<=$(=MakeDate(2017,12,31))'}>}[Qty]),
                  // for product groups, we take the deviation
           Sum({=$(=MakeDate(2017,1,1)))<=$(=MakeDate(2017,12,31))'}>}[Qty])-
           Sum({=$(=MakeDate(2016,1,1)))<=$(=MakeDate(2016,12,31))'}>}[Qty])
   ),
          // if the group is not included in the list of required, then we use this formula
   // in our case, this is the 'Others' group
   Sum({=$(=MakeDate(2017,1,1)))<=$(=MakeDate(2017,12,31))'}>}[Qty])-
   Sum({=$(=MakeDate(2016,1,1)))<=$(=MakeDate(2016,12,31))'}>}[Qty])
   )
Explanation of the code:
At the beginning of the formula, we verify whether the current dimension element is in the data array; if it isn't, we use the formula for the "Others" group.
At the beginning of the formula, we verify whether the current dimension element is in the data array; if it isn't, we use the formula for the "Others" group.
Let's move on to the background color (2):
      If(Attribute = 'Totals', Blue(),
      If(Expression < 0, Red(),Green()))
Next, the expression for shifting columns (3):
If(Attribute <> 'Totals',
    rangesum(above( 'Expression', 1, rowno() )),
    0
 )
This technique is extremely simple: we determine the indent as the sum of the current and all preceding columns for any deviation columns, because otherwise the indent is 0.
As a result, we have the following:
As a result, we have the following: