
/BACK
This article compares and contrasts the development strategy based on the customer's expressed needs and desires with the template implementation technique. In this scenario, the template and ready-made solutions are plainly ineffective when compared to the way of listening to the client's needs.
Qlik Sense offers all of the necessary tools to support this approach. We may combine it with any gadget by utilizing the API.
The application development process, on the other hand, necessitates substantially more money, time, and other resources, and the client may not always agree to such terms.
You can get around this problem by using extensions created by third-party developers. They enable you to close practically any gaps in the system's functioning.
The finest Qlik Sense extensions
A large variety of extensions may be found on the website branch.qlik.com. The most effective of them are listed here. The following criteria were used to assess the product: simplicity of use, lack of software defects, and amount of practical utility.
1. Sense-FieldUI.
It has strong functionality in terms of button and list design, and it also has a large bank of attractive pictures that can be used to create any interface.
It has strong functionality in terms of button and list design, and it also has a large bank of attractive pictures that can be used to create any interface.
2. Show/Hide Container.
An extension that allows you to show/hide items based on their state and replace them with others. Allows users to engage with the app more easily;
An extension that allows you to show/hide items based on their state and replace them with others. Allows users to engage with the app more easily;
3. Climber Custom Report
Provides capabilities to make the editing mode easier to use.
Provides capabilities to make the editing mode easier to use.
4. Sheet Navigation + Actions for Qlik Sense
Extensions that allow you to expand the number of buttons available in the app.
Extensions that allow you to expand the number of buttons available in the app.
5. SenseDateRangePicker
A sleek and practical bootstrap-style calendar for actions with dates, deadlines, and so forth.
A sleek and practical bootstrap-style calendar for actions with dates, deadlines, and so forth.
Brief instructions for utilizing the aforementioned extensions.
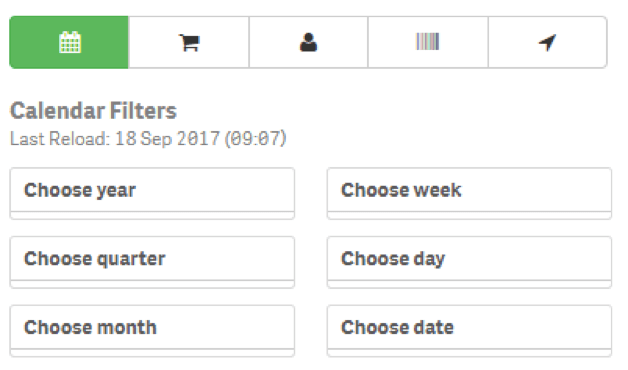
Each image is associated with a unique set of filters. Pop-up windows will make it simpler to comprehend the image's significance.
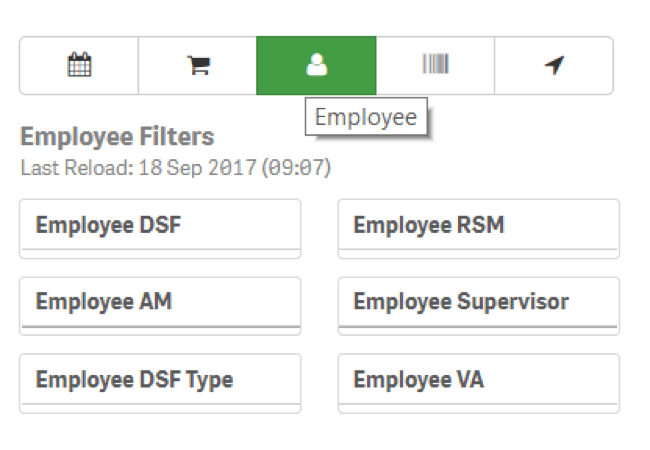
By clicking on the symbol, as seen in the image above, you may move between several sets of filters.
Now, here's a step-by-step guide on making such a switch:
Now, here's a step-by-step guide on making such a switch:
1. Constructing a data isle:
            /* Filter Settings */
            _Filters:
            Load * Inline [
                _Filter, _FilterSortWeight
                Customer,       1
                SKU,    2
                Employee,      3
                Calendar,        4
                Territory,       5
            ];
2. In the sheet, add the "Sense-FieldUI" extension.
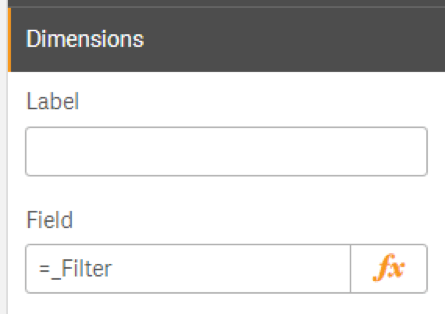
3. In the "Dimensions" tab of the extension settings, choose our "_Filter" field:
4. Select the settings as shown in the image on the "View" tab of the "Settings" section.
It's vital to remember that the text you write in the "Font-Awesome Icons" field influences which pictures appear.
The essential names, as well as the images themselves, may be obtained at https://fontawesome.com/.
Show/Hide Container
Depending on the depth of layering, people typically prefer to see different sorts of diagrams.
Creating a large number of sheets is inconvenient, especially when you consider the navigational challenges that arise as a result of the developers' failure to include a feature like the ability to combine sheets, measures, and measurements, among other things.
Creating a large number of sheets is inconvenient, especially when you consider the navigational challenges that arise as a result of the developers' failure to include a feature like the ability to combine sheets, measures, and measurements, among other things.
1. We start by creating a master visualization.
2. Next, we add a container to the sheet and add master objects with the following display condition to its properties:
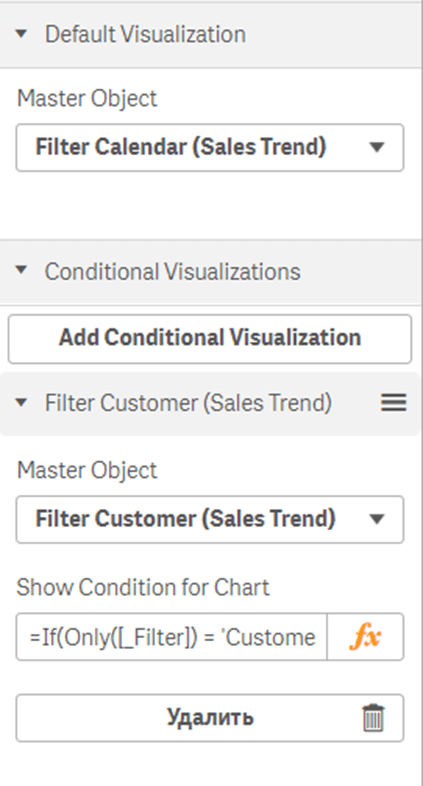
3. Condition of the display:
=If(Only([_Filter]) = 'Customer',1,0)
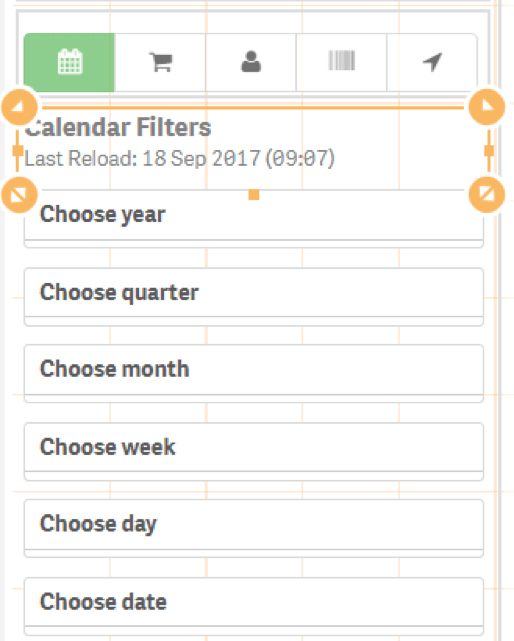
It's worth noting that the presentation of items using this extension isn't always reliable. Each situation necessitates its own analysis.
If you set filters in this container, for example, they will cease hiding completely, and just three points will be visible when zoomed in:
If you set filters in this container, for example, they will cease hiding completely, and just three points will be visible when zoomed in:
Users of various devices have expressed frustration with the frequent loss of filters and the fact that they must exert additional effort to deploy/hide them.
/BACK
This article compares and contrasts the development strategy based on the customer's expressed needs and desires with the template implementation technique. In this scenario, the template and ready-made solutions are plainly ineffective when compared to the way of listening to the client's needs.
Qlik Sense offers all of the necessary tools to support this approach. We may combine it with any gadget by utilizing the API.
The application development process, on the other hand, necessitates substantially more money, time, and other resources, and the client may not always agree to such terms.
You can get around this problem by using extensions created by third-party developers. They enable you to close practically any gaps in the system's functioning.
The finest Qlik Sense extensions
A large variety of extensions may be found on the website branch.qlik.com. The most effective of them are listed here. The following criteria were used to assess the product: simplicity of use, lack of software defects, and amount of practical utility.
1. Sense-FieldUI.
It has strong functionality in terms of button and list design, and it also has a large bank of attractive pictures that can be used to create any interface.
It has strong functionality in terms of button and list design, and it also has a large bank of attractive pictures that can be used to create any interface.
2. Show/Hide Container.
An extension that allows you to show/hide items based on their state and replace them with others. Allows users to engage with the app more easily;
An extension that allows you to show/hide items based on their state and replace them with others. Allows users to engage with the app more easily;
3. Climber Custom Report
Provides capabilities to make the editing mode easier to use.
Provides capabilities to make the editing mode easier to use.
4. Sheet Navigation + Actions for Qlik Sense
Extensions that allow you to expand the number of buttons available in the app.
Extensions that allow you to expand the number of buttons available in the app.
5. SenseDateRangePicker
A sleek and practical bootstrap-style calendar for actions with dates, deadlines, and so forth.
A sleek and practical bootstrap-style calendar for actions with dates, deadlines, and so forth.
Brief instructions for utilizing the aforementioned extensions.
Each image is associated with a unique set of filters. Pop-up windows will make it simpler to comprehend the image's significance.
By clicking on the symbol, as seen in the image above, you may move between several sets of filters.
Now, here's a step-by-step guide on making such a switch:
Now, here's a step-by-step guide on making such a switch:
1. Constructing a data isle:
            /* Filter Settings */
            _Filters:
            Load * Inline [
                _Filter, _FilterSortWeight
                Customer,       1
                SKU,    2
                Employee,      3
                Calendar,        4
                Territory,       5
            ];
2. In the sheet, add the "Sense-FieldUI" extension.
3. In the "Dimensions" tab of the extension settings, choose our "_Filter" field:
4. Select the settings as shown in the image on the "View" tab of the "Settings" section.
It's vital to remember that the text you write in the "Font-Awesome Icons" field influences which pictures appear.
The essential names, as well as the images themselves, may be obtained at https://fontawesome.com/.
Show/Hide Container
Depending on the depth of layering, people typically prefer to see different sorts of diagrams.
Creating a large number of sheets is inconvenient, especially when you consider the navigational challenges that arise as a result of the developers' failure to include a feature like the ability to combine sheets, measures, and measurements, among other things.
Creating a large number of sheets is inconvenient, especially when you consider the navigational challenges that arise as a result of the developers' failure to include a feature like the ability to combine sheets, measures, and measurements, among other things.
1. We start by creating a master visualization.
2. Next, we add a container to the sheet and add master objects with the following display condition to its properties:
3. Condition of the display:
=If(Only([_Filter]) = 'Customer',1,0)
It's worth noting that the presentation of items using this extension isn't always reliable. Each situation necessitates its own analysis.
If you set filters in this container, for example, they will cease hiding completely, and just three points will be visible when zoomed in:
If you set filters in this container, for example, they will cease hiding completely, and just three points will be visible when zoomed in:
Users of various devices have expressed frustration with the frequent loss of filters and the fact that they must exert additional effort to deploy/hide them.